With Extreme Power comes Extreme Responsibility
Have you ever wondered why RSSI values from validation surveys don’t match your predictive design? Have you wondered why changing the AP transmit power doesn’t always correspond with RSSI values for the client? There are some subtle nuances to be aware of when setting the transmit power on Extreme Networks (formerly Aerohive) access points and Ekahau Pro.
The nuances boil down to understanding how the transmit power setting is mapped to EIRP – both on the APs themselves and within Ekahau.
First, let’s define a couple terms:
Transmit power: also called conducted power, the energy in mW or dBm that leaves the radio transmitter, before reaching the antenna.
EIRP (Effective Isotropic Radiated Power): the energy radiating out of the antenna. It includes conducted power, plus gain of the antenna along with gain from aggregate spatial streams and this is precisely how Extreme APs internally calculated the EIRP, as shown from the CLI of IQ Firmware:
EIRP=Effective Isotropic Radiated Power (Transmit Power + Max Antenna Gain + Max TX Chains Gain);Let’s focus on the Extreme AP650 & AP50X with the datasheet for these APs found here. The datasheet indicates a peak antenna gain of 5.0/6.0dBi on the AP650 for 2.4/5GHz. Note that via the CLI the antenna gain is indicated as 4.50/6.00dBi, as shown later in this article. All data below is from APs running 10.0r8 (latest version as 11/04/2020)
Transmit power can be configured via CLI as shown below:
AP-19#interface wifi0 radio txpower 8

AP-19#interface wifi1 radio txpower 14
Interface Channel select state Primary channel Channel width Power ctrl state Tx power(dbm) Use Last Selection
——— ——————— —————- ————- ——————— ————- ———————
Wifi0 Enable 1 20 Enable 8 Channel:No Power:No
Wifi1 Enable 36 20 Enable 14 Channel:No Power:No
The antenna gain contributing to EIRP is shown in the output below and represents the second contribution towards EIRP.
AP-19#sh int wifi0 | i Diversity

Freq(Chan)=2412Mhz(1); EIRP power=18.52dBm(8dBm + 4.50dBi + 6.02dBi); Diversity=disabled;

AP-19#sh int wifi1 | i Diversity

Freq(Chan)=5180Mhz(36); EIRP power=20.00dBm(14dBm + 6.00dBi + 0.00dBi); Diversity=disabled;
Currently, there appears to be a bug in calculating the max gain from the transmit-chains for wifi1 as the value remains 0.00dBi regardless of the number of transmit-chains set. Changing wifi0 to any other transmit-chain radio setting on the 650X does alter this value.
Antenna gains from the stock omni-directional antennas show EIRP details for the AP650X with 4 transmit-chains enabled (default) is shown below:
AP-20#sh int wifi0 | i Diversity

Freq(Chan)=2437Mhz(6); EIRP power=17.02dBm(8dBm + 3.00dBi + 6.02dBi); Diversity=disabled;

AP-19#sh int wifi1 | i Diversity

Freq(Chan)=5765Mhz(153); EIRP power=25.02dBm(14dBm + 5.00dBi + 6.02dBi); Diversity=disabled;
The final contribution towards EIRP comes from the number of enabled transmit-chains (i.e. spatial streams) and is listed in the table below. Note: changing the number of spatial streams in Ekahau does not impact the simulated EIRP value.
| # of Transmit-Chains | Resulting gain benefit (dBi) |
|---|---|
| 1 | 0 |
| 2 | 3.01 |
| 3 | 4.77 |
| 4 | 6.02 |
The number of enabled transmit-chains corresponding to gain on the AP is verified as show below:
! identify the radio profile assigned to the AP
AP-19#sh int wifi0 | i Primary
Primary radio profile=radio_ng_11ax-2g;
! set the number transmit chains
AP-19#radio profile radio_ng_11ax-2g transmit-chain 2
! verify the gain contributed by the number of transmit chains
AP-19#sh int wifi0 | i Diversity
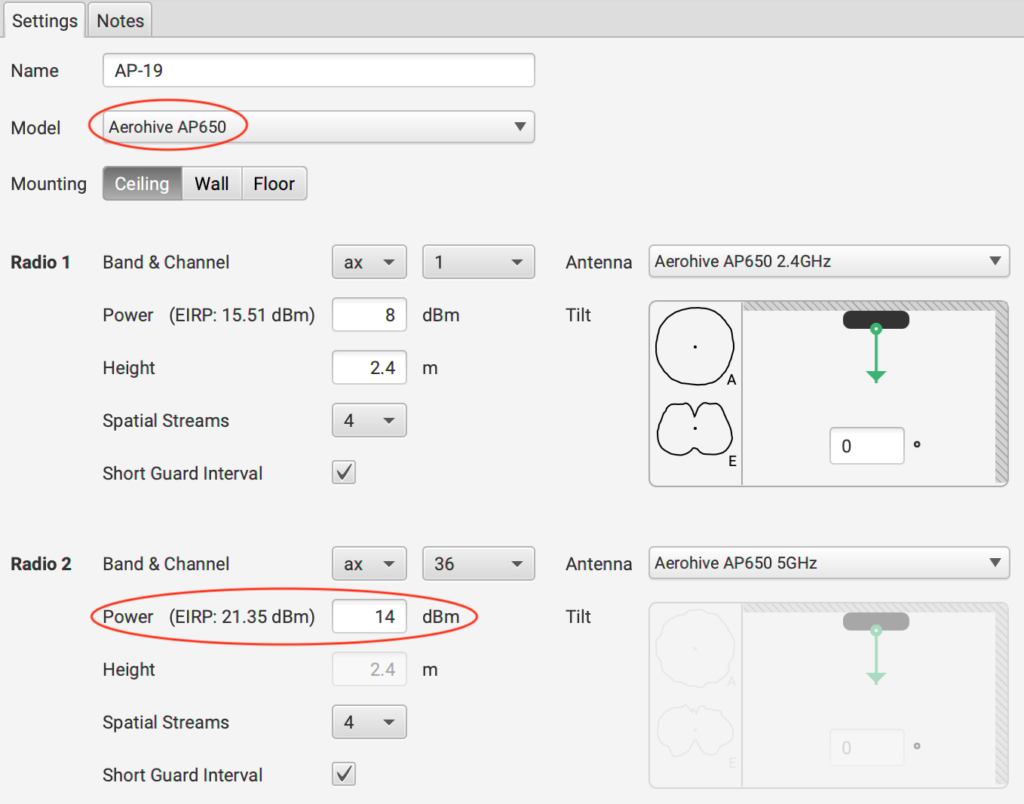
Freq(Chan)=2412Mhz(1); EIRP power=27.51dBm(20dBm + 4.50dBi + 3.01dBi); Diversity=disabled;Transmit power is configured in Ekahau, as shown below. Antenna gain is added to the Tx power yielding the EIRP shown in brackets beside the power field. Ekahau uses the configured EIRP to model RF propagation from simulated radios using free space path loss models. Once calculated, values are then able to be displayed in a colourful heat map visualization, easily consumed by the humans.

The table below shows EIRP values from the AP650 access point compared to what Ekahau derives from the configured Tx Power. The values in the table assume the correct value for the gain contributed by the number of transmit-chains on wifi1.
| Tx Power (dBm) | 2.4GHz Antenna Gain (dBi) | 5GHz Antenna Gain (dBi) | SS Gain (dBi) | AP650 EIRP 2.4GHz (dBm) | AP650 EIRP 5GHz (dBm) | Ekahau Simulated EIRP 2.4GHz (dBm) | Ekahau Simulated EIRP 5GHz (dBm) | Delta EIRP 2.4GHz (dBm) | Delta EIRP 5GHz (dBm) |
|---|---|---|---|---|---|---|---|---|---|
| 20 | 4.50 | 6.00 | 6.02 | 30.52 | 32.02 | 27.51 | 27.35 | 3.01 | 4.67 |
| 17 | 4.50 | 6.00 | 6.02 | 27.52 | 29.02 | 24.51 | 24.35 | 3.01 | 4.67 |
| 14 | 4.50 | 6.00 | 6.02 | 24.52 | 26.02 | 21.51 | 21.35 | 3.01 | 4.67 |
| 11 | 4.50 | 6.00 | 6.02 | 21.52 | 23.02 | 18.51 | 18.35 | 3.01 | 4.67 |
| 8 | 4.50 | 6.00 | 6.02 | 18.52 | 20.02 | 15.51 | 15.35 | 3.01 | 4.67 |
| 5 | 4.50 | 6.00 | 6.02 | 15.52 | 17.02 | 12.51 | 12.35 | 3.01 | 4.67 |
| 2 | 4.50 | 6.00 | 6.02 | 12.52 | 14.02 | 9.51 | 9.35 | 3.01 | 4.67 |
| 20 | 4.50 | 6.00 | 4.77 | 29.27 | 30.77 | 27.51 | 27.35 | 1.76 | 3.42 |
| 17 | 4.50 | 6.00 | 4.77 | 26.27 | 27.77 | 24.51 | 24.35 | 1.76 | 3.42 |
| 14 | 4.50 | 6.00 | 4.77 | 23.27 | 24.77 | 21.51 | 21.35 | 1.76 | 3.42 |
| 11 | 4.50 | 6.00 | 4.77 | 20.27 | 21.77 | 18.51 | 18.35 | 1.76 | 3.42 |
| 8 | 4.50 | 6.00 | 4.77 | 17.27 | 18.77 | 15.51 | 15.35 | 1.76 | 3.42 |
| 5 | 4.50 | 6.00 | 4.77 | 14.27 | 15.77 | 12.51 | 12.35 | 1.76 | 3.42 |
| 2 | 4.50 | 6.00 | 4.77 | 11.27 | 12.77 | 9.51 | 9.35 | 1.76 | 3.42 |
| 20 | 4.50 | 6.00 | 3.01 | 27.51 | 29.01 | 27.51 | 27.35 | 0.00 | 1.66 |
| 17 | 4.50 | 6.00 | 3.01 | 24.51 | 26.01 | 24.51 | 24.35 | 0.00 | 1.66 |
| 14 | 4.50 | 6.00 | 3.01 | 21.51 | 23.01 | 21.51 | 21.35 | 0.00 | 1.66 |
| 11 | 4.50 | 6.00 | 3.01 | 18.51 | 20.01 | 18.51 | 18.35 | 0.00 | 1.66 |
| 8 | 4.50 | 6.00 | 3.01 | 15.51 | 17.01 | 15.51 | 15.35 | 0.00 | 1.66 |
| 5 | 4.50 | 6.00 | 3.01 | 12.51 | 14.01 | 12.51 | 12.35 | 0.00 | 1.66 |
| 2 | 4.50 | 6.00 | 3.01 | 9.51 | 11.01 | 9.51 | 9.35 | 0.00 | 1.66 |
| 20 | 4.50 | 6.00 | 0 | 24.50 | 26.00 | 27.51 | 27.35 | -3.01 | -1.35 |
| 17 | 4.50 | 6.00 | 0 | 21.50 | 23.00 | 24.51 | 24.35 | -3.01 | -1.35 |
| 14 | 4.50 | 6.00 | 0 | 18.50 | 20.00 | 21.51 | 21.35 | -3.01 | -1.35 |
| 11 | 4.50 | 6.00 | 0 | 15.50 | 17.00 | 18.51 | 18.35 | -3.01 | -1.35 |
| 8 | 4.50 | 6.00 | 0 | 12.50 | 14.00 | 15.51 | 15.35 | -3.01 | -1.35 |
| 5 | 4.50 | 6.00 | 0 | 9.50 | 11.00 | 12.51 | 12.35 | -3.01 | -1.35 |
| 2 | 4.50 | 6.00 | 0 | 6.50 | 8.00 | 9.51 | 9.35 | -3.01 | -1.35 |
The table below shows EIRP values from the AP650X access point compared to what Ekahau derives from the configured Tx Power.
| Tx Power (dBm) | 2.4GHz Antenna Gain (dBi) | 5GHz Antenna Gain (dBi) | SS Gain (dBi) | AP650X EIRP 2.4GHz (dBm) | AP650X EIRP 5GHz (dBm) | Ekahau Simulated EIRP 2.4GHz (dBm) | Ekahau Simulated EIRP 5GHz (dBm) | Delta EIRP 2.4GHz (dBm) | Delta EIRP 5GHz (dBm) |
|---|---|---|---|---|---|---|---|---|---|
| 20 | 3.00 | 5.00 | 6.02 | 29.02 | 31.02 | 27.9 | 28.49 | 1.12 | 2.53 |
| 17 | 3.00 | 5.00 | 6.02 | 26.02 | 28.02 | 24.9 | 25.49 | 1.12 | 2.53 |
| 14 | 3.00 | 5.00 | 6.02 | 23.02 | 25.02 | 21.9 | 22.49 | 1.12 | 2.53 |
| 11 | 3.00 | 5.00 | 6.02 | 20.02 | 22.02 | 18.9 | 19.49 | 1.12 | 2.53 |
| 8 | 3.00 | 5.00 | 6.02 | 17.02 | 19.02 | 15.9 | 16.49 | 1.12 | 2.53 |
| 5 | 3.00 | 5.00 | 6.02 | 14.02 | 16.02 | 12.9 | 13.49 | 1.12 | 2.53 |
| 2 | 3.00 | 5.00 | 6.02 | 11.02 | 13.02 | 9.9 | 10.49 | 1.12 | 2.53 |
| 20 | 3.00 | 5.00 | 4.77 | 27.77 | 29.77 | 27.9 | 28.49 | -0.13 | 1.28 |
| 17 | 3.00 | 5.00 | 4.77 | 24.77 | 26.77 | 24.9 | 25.49 | -0.13 | 1.28 |
| 14 | 3.00 | 5.00 | 4.77 | 21.77 | 23.77 | 21.9 | 22.49 | -0.13 | 1.28 |
| 11 | 3.00 | 5.00 | 4.77 | 18.77 | 20.77 | 18.9 | 19.49 | -0.13 | 1.28 |
| 8 | 3.00 | 5.00 | 4.77 | 15.77 | 17.77 | 15.9 | 16.49 | -0.13 | 1.28 |
| 5 | 3.00 | 5.00 | 4.77 | 12.77 | 14.77 | 12.9 | 13.49 | -0.13 | 1.28 |
| 2 | 3.00 | 5.00 | 4.77 | 9.77 | 11.77 | 9.9 | 10.49 | -0.13 | 1.28 |
| 20 | 3.00 | 5.00 | 3.01 | 26.01 | 28.01 | 27.9 | 28.49 | -1.89 | -0.48 |
| 17 | 3.00 | 5.00 | 3.01 | 23.01 | 25.01 | 24.9 | 25.49 | -1.89 | -0.48 |
| 14 | 3.00 | 5.00 | 3.01 | 20.01 | 22.01 | 21.9 | 22.49 | -1.89 | -0.48 |
| 11 | 3.00 | 5.00 | 3.01 | 17.01 | 19.01 | 18.9 | 19.49 | -1.89 | -0.48 |
| 8 | 3.00 | 5.00 | 3.01 | 14.01 | 16.01 | 15.9 | 16.49 | -1.89 | -0.48 |
| 5 | 3.00 | 5.00 | 3.01 | 11.01 | 13.01 | 12.9 | 13.49 | -1.89 | -0.48 |
| 2 | 3.00 | 5.00 | 3.01 | 8.01 | 10.01 | 9.9 | 10.49 | -1.89 | -0.48 |
| 20 | 3.00 | 5.00 | 0 | 23.00 | 25.00 | 27.9 | 28.49 | -4.90 | -3.49 |
| 17 | 3.00 | 5.00 | 0 | 20.00 | 22.00 | 24.9 | 25.49 | -4.90 | -3.49 |
| 14 | 3.00 | 5.00 | 0 | 17.00 | 19.00 | 21.9 | 22.49 | -4.90 | -3.49 |
| 11 | 3.00 | 5.00 | 0 | 14.00 | 16.00 | 18.9 | 19.49 | -4.90 | -3.49 |
| 8 | 3.00 | 5.00 | 0 | 11.00 | 13.00 | 15.9 | 16.49 | -4.90 | -3.49 |
| 5 | 3.00 | 5.00 | 0 | 8.00 | 10.00 | 12.9 | 13.49 | -4.90 | -3.49 |
| 2 | 3.00 | 5.00 | 0 | 5.00 | 7.00 | 9.9 | 10.49 | -4.90 | -3.49 |
Management and control frames are transmitted using a single transmit-chain; however, the number of transmit-chains used for data frames fluctuate dynamically between 1 and 4 based on RF conditions and client capabilities. Passive post-validation surveys measure RSSI from only beacon (management) frames to generate the Signal Strength visualization – meaning data frames could have greater relative RSSI values.
An interesting observation is the board capability vs regulatory limit break down for transmit power per transmit-chain. The regulatory domain is set to Canada (CA) for the data points collected below. With CA set, channels 120 – 128, and 144 are NOT supported.
! AP650

AP-19#sh int wifi0 | i Board

Board limit=20dBm(1) 20dBm(2) 20dBm(3) 20dBm(4); Regulatory limit=24dBm(1) 23dBm(2) 22dBm(3) 22dBm(4);

AP-19#sh int wifi1 | i Board

Board limit=21dBm(1) 21dBm(2) 21dBm(3) 21dBm(4); Regulatory limit=16dBm(1) 11dBm(2) 7dBm(3) 7dBm(4);


! AP650X

AP-20#sh int wifi0 | i Board

Board limit=20dBm(1) 20dBm(2) 20dBm(3) 20dBm(4); Regulatory limit=23dBm(1) 23dBm(2) 23dBm(3) 23dBm(4);

AP-20#sh int wifi1 | i Board

Board limit=21dBm(1) 21dBm(2) 21dBm(3) 21dBm(4); Regulatory limit=26dBm(1) 22dBm(2) 19dBm(3) 19dBm(4);
A breakdown per band for the AP650 is shown below (CA domain):
| Channel | (1) Board limit (dBm) | (2) Board limit (dBm) | (3 Board limit (dBm) | (4) Board limit (dBm) | (1) Regulatory limit (dBm) | (2) Regulatory limit (dBm) | (3) Regulatory limit (dBm) | (4) Regulatory limit (dBm) |
| 2.4 GHz | 20 | 20 | 20 | 20 | 24 | 23 | 22 | 22 |
| Band | (1) Board limit (dBm) | (2) Board limit (dBm) | (3) Board limit (dBm) | (4) Board limit (dBm) | (1) Regulatory limit (dBm) | (2) Regulatory limit (dBm) | (3) Regulatory limit (dBm) | (4) Regulatory limit (dBm) |
| UNII-1 | 21 | 21 | 21 | 21 | 16 | 11 | 7 | 7 |
| UNII-2 | 21 | 21 | 21 | 21 | 22 | 19 | 13 | 13 |
| UNII-2E | 21 | 21 | 21 | 21 | 22 | 19 | 13 | 13 |
| UNII-3 | 21 | 21 | 21 | 21 | 25 | 21 | 19 | 19 |
A breakdown per band for the AP650X is shown below (CA domain):
| Channel | (1) Board limit (dBm) | (1) Board limit (dBm) | (1) Board limit (dBm) | (1) Board limit (dBm) | (1) Regulatory limit (dBm) | (1) Regulatory limit (dBm) | (1) Regulatory limit (dBm) | (1) Regulatory limit (dBm) |
| 2.4 GHz | 20 | 20 | 20 | 20 | 23 | 23 | 23 | 23 |
| Band | (1) Board limit (dBm) | (1) Board limit (dBm) | (1) Board limit (dBm) | (1) Board limit (dBm) | (1) Regulatory limit (dBm) | (1) Regulatory limit (dBm) | (1) Regulatory limit (dBm) | (1) Regulatory limit (dBm) |
| UNII-1 | 21 | 21 | 21 | 21 | 16 | 11 | 6 | 6 |
| UNII-2 | 21 | 21 | 21 | 21 | 24 | 20 | 14 | 14 |
| UNII-2E | 21 | 21 | 21 | 21 | 24 | 20 | 14 | 14 |
| UNII-3 | 21 | 21 | 21 | 21 | 26 | 22 | 19 | 19 |
The rabbit hole goes even deeper. Gregor Vucajnk presented at WLCP 2018 – RSSI Revealed. This talk identifies different ways that client devices measure RSSI. The video can be watched here:
On a final note, I want to give a shout out to @theITrebel for his blog post at https://blog.theitrebel.com/2020/01/30/mind-your-ekahau-power-levels/ which inspired me to investigate power settings with some Extreme APs.
Slàinte!