AP Colour Update in Ekahau AI Pro 11.1.1
Previously, I wrote about the ability to customize report templates in Ekahau Pro using AP colours:
With the release of Ekahau AI Pro 11.1.1 on October 13th, 2022, three (3) new colours were added to provide even more options for WLAN professionals to tag and differentiate APs. The three new colours are:
- Mint
- Green (but not the same shade of green as in Ekahau Pro)
- Brown
Available AP colour tagging options now available are summarized in the table below:
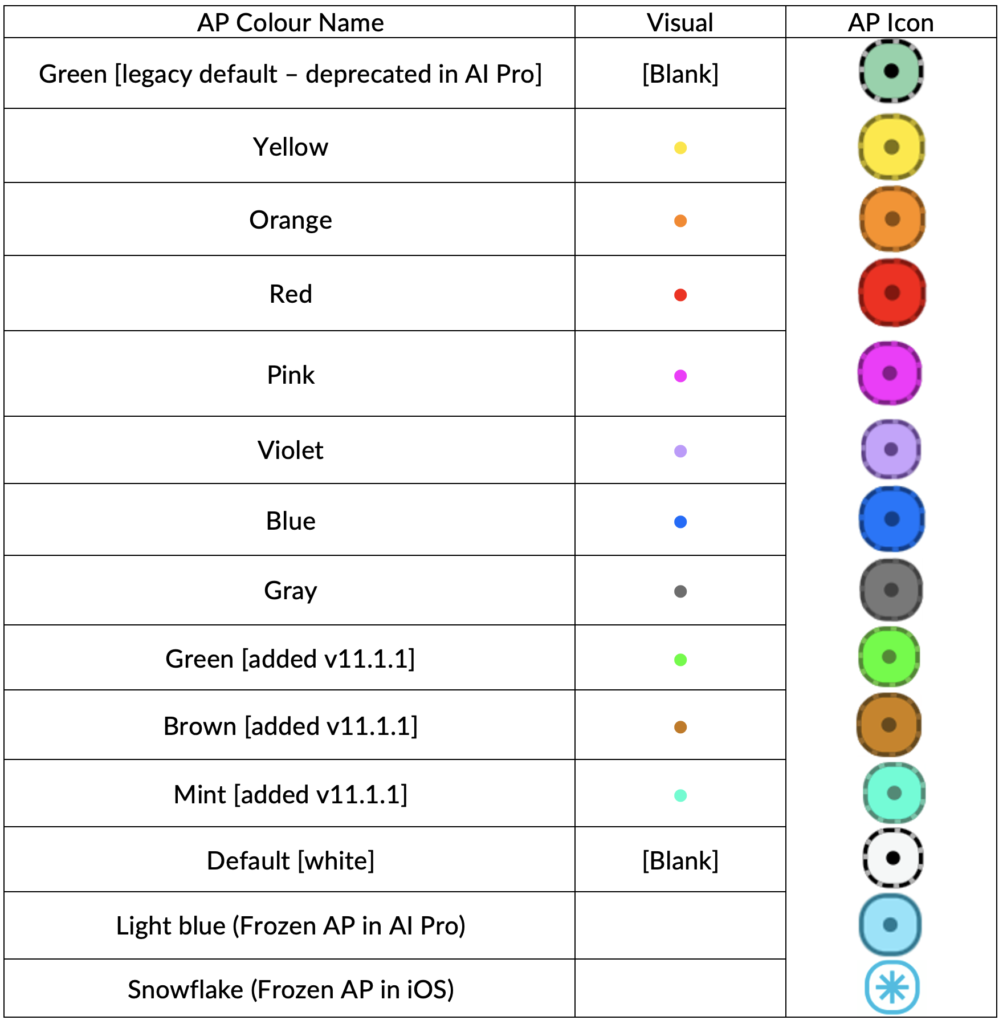
Remember, AP colours can now be used to mark APs in the same way as the “My AP” concept was used in Ekahau Pro. “My APs” or “green APs” were simply a group of APs tagged with a colour. Now, APs can be coloured with many different options and that colour can in turn be used to filter or purposely display APs in report templates or during WLAN analysis.
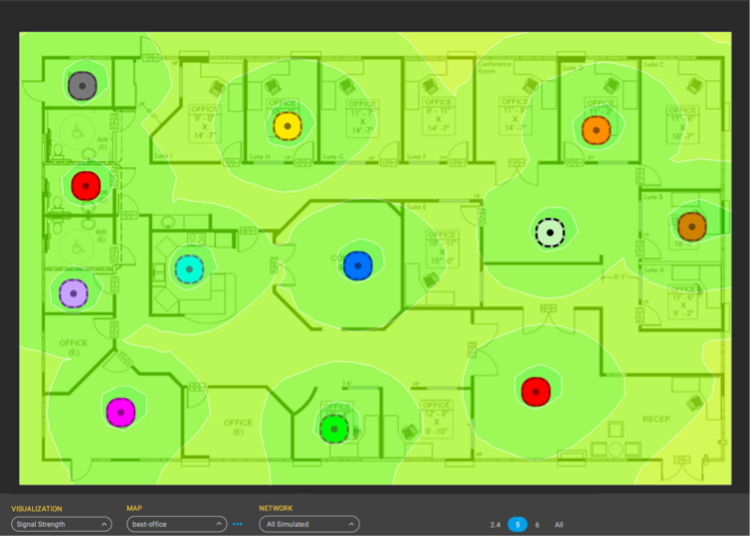
You can display the heatmap of one or more selected APs by filtering using colour. For the heatmap filter to work successfully, filters must be applied in the heatmap object (not the aps object) of the visualization tag.
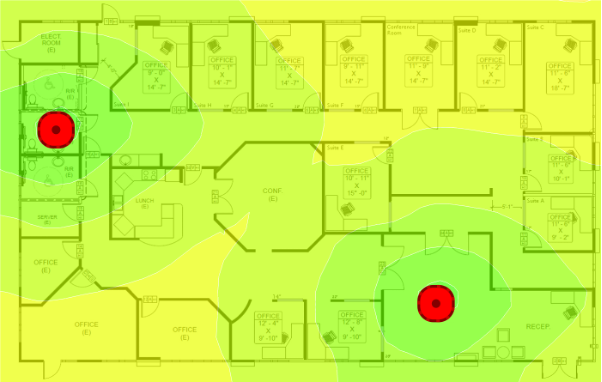
The first example shows a heatmap displaying the signal from ALL APs within AI Pro.
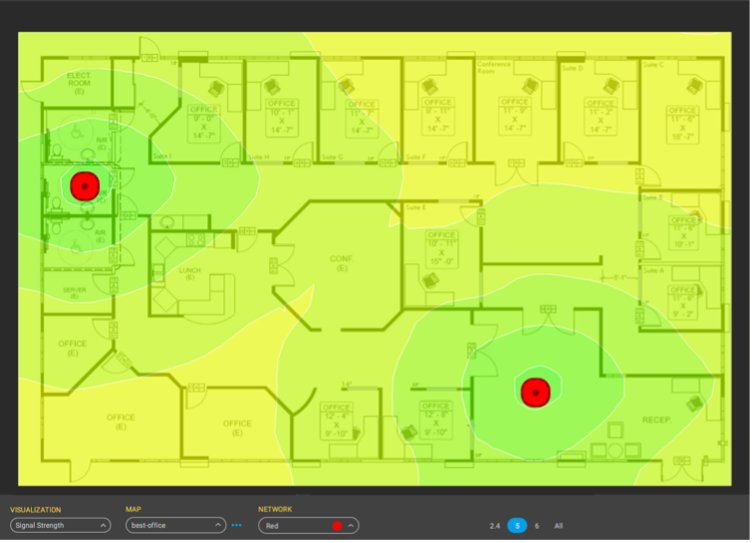
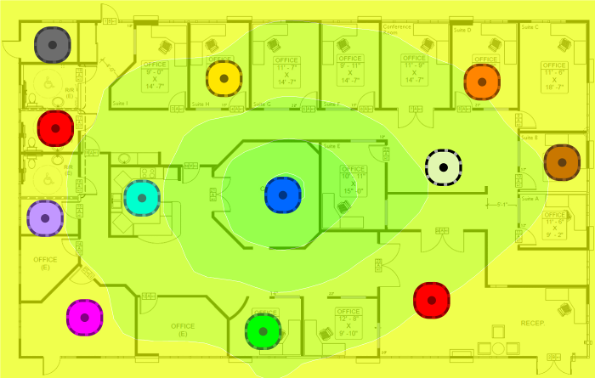
The next example displays the heatmap of only the APs matching the filtered colour (red in this case) as selected in the network dropdown. When applying this display filter, only the AP(s) matching the selected colour are displayed; all other AP(s) are hidden from the map.
Using colour filters in report templates
When the “ap-color” filter is applied to the heatmap object in a visualization tag, only the heatmap data associated with the coloured APs is displayed on the heatmap visualization generated in the report. An example of the template code is shown below:
<#”loop-start” : {“type” : “floors”}#>
<#{
  "visualization" : {
    "heatmap" : {
      "adapter" : "Mobile Device",
      "type" : "sig-strength",
      "filter" : {
        "include" : {
          "band" : "5",
          “ap-color”: ”red”
        }
      }
    },
    “aps”:{}
  }
}#>
<#”loop-end” : {“type” : “floors”}#>
When using the template code from above, the display is filtered to show only the heatmap resulting from ‘red’ APs, however all APs are displayed on the heatmap.
When the “ap-color” filter is applied to the “aps” object, only filtered AP(s) along with the filtered heatmap appear in the visualization generated in the report. Below is an example of the modified code with “ap-color” in both the “heatmap” and “aps” object.
<#”loop-start” : {“type” : “floors”}#>
<#{
  "visualization" : {
    "heatmap" : {
      "adapter" : "Mobile Device",
      "type" : "sig-strength",
      "filter" : {
        "include" : {
          "band" : "5",
          “ap-color”: ”red”
        }
      }
    },
    “aps”:{
      “show-name”: ”false”,
      "filter" : {
        "include" : {
          “ap-color”: ”red”
        }
      }
    }
  }
}#>
<#”loop-end” : {“type” : “floors”}#>
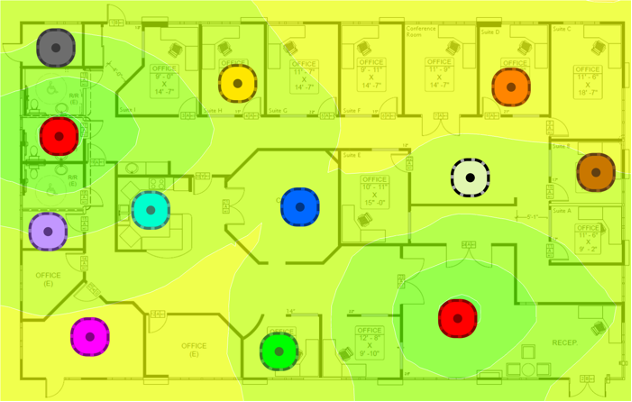
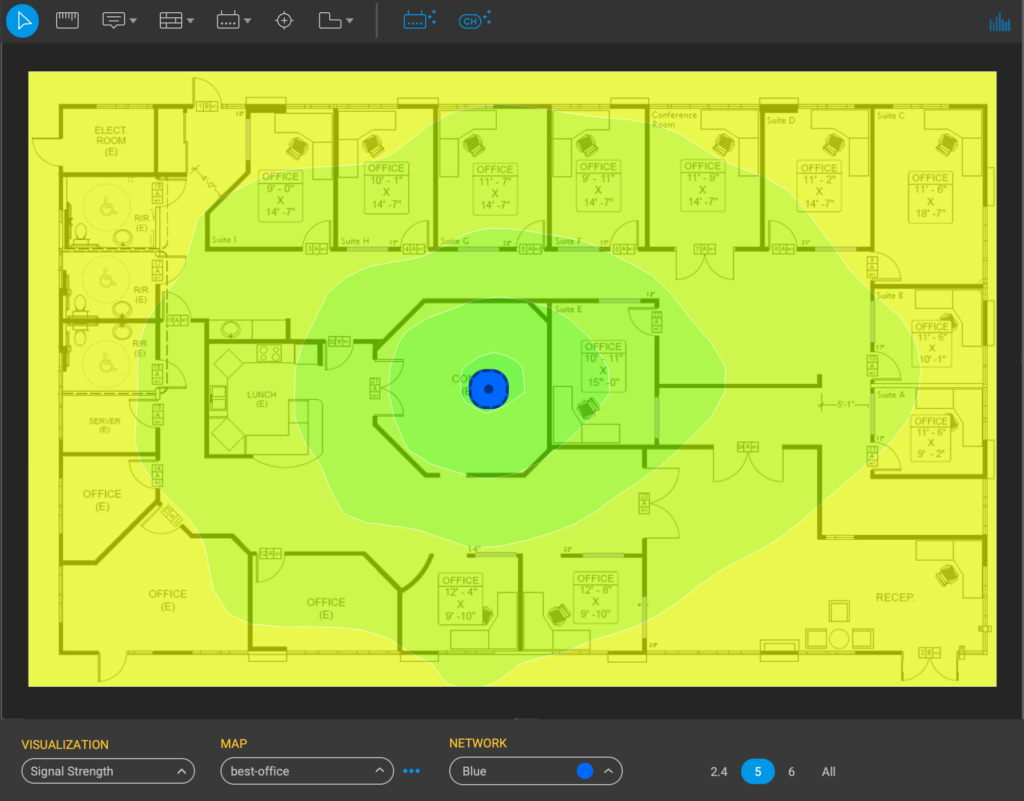
Below is an example of the visualization generated in the report based on using “ap-color” to filter only red APs applied to both the “heatmap” and “aps” objects:
NETWORK Colour Filter (dropdown)
If no “ap-color” filter is used in the visualization tag and a colour filter is applied using the NETWORK dropdown within AI Pro, the displayed heatmap in the report will show only heatmap data. In this case ALL APs will be displayed on the map, but the heatmap from only the APs of selected colour will be displayed.
AI Pro will display only the AP(s) of selected colour, if AP(s) are filtered using the NETWORK dropdown in AI Pro (example shown for Blue AP):
When using the template code below which does NOT contain any “ap-color” filter(s), the corresponding heatmap in generated reports is filtered to display heatmap details of the AP colour filtered in the NETWORK dropdown:
<#”loop-start” : {“type” : “floors”}#>
<#{
  "visualization" : {
    "heatmap" : {
      "adapter" : "Mobile Device",
      "type" : "sig-strength",
      "filter" : {
        "include" : {
          "band" : "5"
        }
      }
    },
    “aps”:{}
  }
}#>
<#”loop-end” : {“type” : “floors”}#>
An example of the resulting heatmap generated in the report is shown below. It displays ALL APs, but only the heatmap details of the AP(s) filtered by the colour selected in the NETWORK dropdown within AI Pro:
Sláinte!
Resources
Ekahau Visualisation Tag Report Template Documentation
https://support.ekahau.com/hc/en-us/articles/115005161607-Visualization-Tags
Ekahau AI Pro Release notes