Data Collected During an Active Survey
Overview
This article details data that can be collected based on the configuration of active survey mode when using Ekahau.
I’m skipping the debate over whether an active survey should be performed and assuming that a business decision requires one. With an active survey required, this article identifies the data types collected in various active configuration modes. Given that an active survey will be performed – here is an example of the data that can be collected and displayed.
Survey Methods
Stop & Go: This survey method is ideal for situations where you need more control or awareness of your surroundings. It provides more targeted data collection than continuous surveys but is also slower.
It’s helpful in:
- Challenging environments where you need to be cautious or safety policies do not allow walking while using the computer.
- Densely furnished areas where it is difficult to walk at a constant pace or where the signal can be more variable.
- Situations where you want to focus on specific points of interest.
Continuous: This survey method is faster than the Stop & Go method because you only need to click at the beginning and end of a straight path (like a hallway). The rules for clicking are when you start, stop, or turn. However, it requires you to walk at a steady pace and click whenever you turn or stop for more than a second; this ensures accurate data collection.
GPS: GPS surveys leverage GNSS technology to simplify the data collection process during Wi-Fi site surveys and avoid the need to regularly mark one’s position on the map. Outdoor maps are loaded from Apple Maps as floor plans with embedded GPS and scale information. The GPS received in your LTE-capable iOS device tracks your location during the survey, freeing you from manually clicking on the map for each data point. Ekahau GPS surveys primarily function well in outdoor environments with a clear GPS signal.
Autopilot: This survey method utilizes your mobile device’s camera and motion sensors to track your location and gather Wi-Fi data automagically. Your position on the map is automagically tracked, leveraging features like Apple ARKit (Augmented Reality) and LiDAR (on compatible devices). Autopilot surveys are significantly quicker and less demanding than stop-and-go or continuous surveys. However, you may need to routinely mark your position on the map to true up your actual location, as there may be some drift over time.
JustGo: This survey mode is designed for ultimate simplicity and ease of use without the need for a pre-existing floor plan. Similar to Autopilot, it leverages AR technology to map your environment as you walk automagically. Simply walk around the area you’re surveying, and the app automatically builds a floor plan and gathers Wi-Fi data simultaneously, making the relationship between the data collected and the map position highly accurate. The key benefit of JustGo is for small sites when the floor plan or a high-quality floor plan is not available.

The last three methods are essentially optimized extensions of a continuous survey, which offer various ways to reduce the frequency of marking one’s position on the floor plan while performing a survey. Autopilot requires occasional trueing-up of the actual position by tapping the screen. GPS and JustGo simply require the wireless practitioner to start and end the survey. Positions are automatically captured based on GNSS information or relative proximity determined by the LiDAR camera and AR Kit.
Types of Surveys
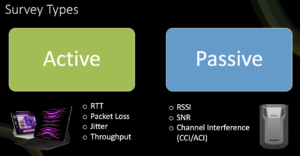
Passive Survey
One must always perform a passive survey. The WNICs in a Sidekick 1 (2 WNICs) or Sidekick 2 (4 WNICs) measure signal information by listening to beacon frames. Passive means this is a listen-only process, and the Sidekick WNICs send no frames during a passive survey. Metrics gathered during a passive survey include RSSI, SNR, and channel interference.
Active Survey
One may optionally perform an active survey – but it is NOT required. Active surveys are performed simultaneously or in parallel to the passive survey. They differ from passive surveys as a test device such as a laptop, tablet, or smartphone associates to the WLAN and actively transmits data – ICMP or iPerf. It is important to note that the Sidekick does NOT associate with the WLAN; the device connected to the Sidekick must be associated. The test device may need to be configured with a PSK or 802.1X credentials, or it may need to complete the captive portal page to establish network connectivity successfully. Metrics gathered during an active survey may include throughput, packet loss, jitter, and RTT.
Modes of Active Survey
There are two modes in which an active survey can be configured – Ping or Throughput.

Ping
When Ping is used, ICMP traffic is sent between the DUT and the ping destination. AI Pro allows WLAN practitioners to configure any destination IP address, such as a device in the communications closet, data center, or a server on the Internet (e.g., DNS, 1.1.1.1, or 8.8.8.8). As Ping is used to measure round-trip time (RTT), it is crucial to consider what path along the network is being measured. RTT to a switch in the edge comm closet will be much less than the RTT to a server across the LAN and out onto the internet. Be mindful of comparisons to the wired network to ensure you compare apples to apples.
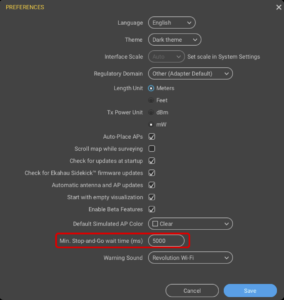
During Continuous/GPS/Autopilot/JustGo survey modes, Ping continually runs while collecting survey data. In Stop & Go mode within AI APro, the duration of the spinning wheel is set via the preferences menu, with the default of 5000 ms or 5 seconds. You can change this to 10000 ms if you want to run the Stop & Go interval longer, which may be helpful if scanning ALL channels on 2.4, 5, and 6 GHz. Even with the 4 WNICs in the Sidekick 2, scanning ALL channels on the three bands can take more than 5 seconds.
Note that the timer is not currently configurable on iOS/Android devices; by default, the Stop & Go survey will scan for 5 seconds during each cycle.
Throughput
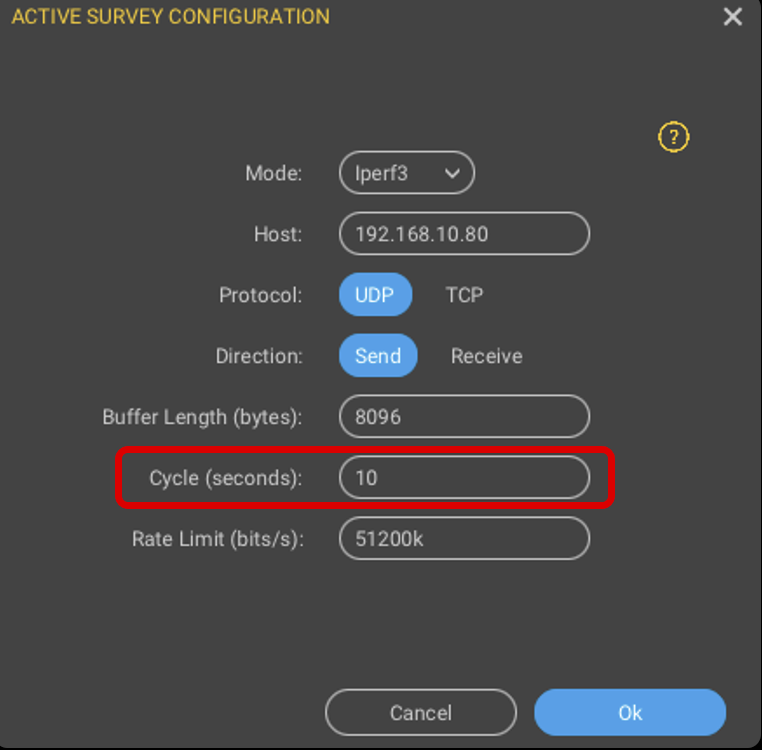
During all survey modes, the cycle time is used to configure the intervals during which a TCP or UDP test will run. Note that cycle time also impacts the length of Stop & Go surveys when running in throughput (non-Ping) mode. The default Cycle time is 10 seconds, but this can, of course, be modified. For example, if set to 20 seconds, each iPerf interval would last 20 seconds, and during a Stop & Go survey, you would have to twiddle your thumbs for 20 seconds while standing still until the spinning wheel completes.
I kid about twiddling your thumbs; I once walked into the smallest classroom I’ve ever seen, and students had littered their backpacks across the floor. In this room, I performed a Stop & Go survey. The exciting thing about surveying classrooms is that all students stop talking and stare at you when you enter the classroom. You can tell from the looks on their faces that they think WLAN practitioners have the most incredible job in the world, and you don’t want to let those impressionable minds down. So while you are waiting for the 10 or 20-second cycle time to complete, look around the room while nodding your head like you are making essential observations – ceiling type, mounting locations, power outlets, network drops, doors, windows…anything to make it look like you are not just twiddling your thumbs. We each must do our part to inspire the next generation of WLAN practitioners.
Throughput tests can be divided into four types of traffic flow. There is UDP and TCP, which can be operated in send or receive mode. iPerf is used to generate the throughput traffic, which means there must be an iPerf client and server. The client is the DUT, and the server can be physical or virtual, connected to an APoS using a WLANPi, a switch in the comm closet, a distribution switch in the data center or running on a server on the other side of the internet. There are many options, but again, it’s essential to be mindful of the network path over which you blast the packets.
The send and receive modes are defined from the DUT’s perspective. Send Mode will transmit traffic upstream from the DUT (client) to the server, while Receive Mode will transmit data from the server to the DUT (client). A full active test should measure performance in both directions.
Note that throughput survey mode is not currently supported on iOS/Android devices. Throughput, packet loss, and jitter cannot be measured.
What data is collected?
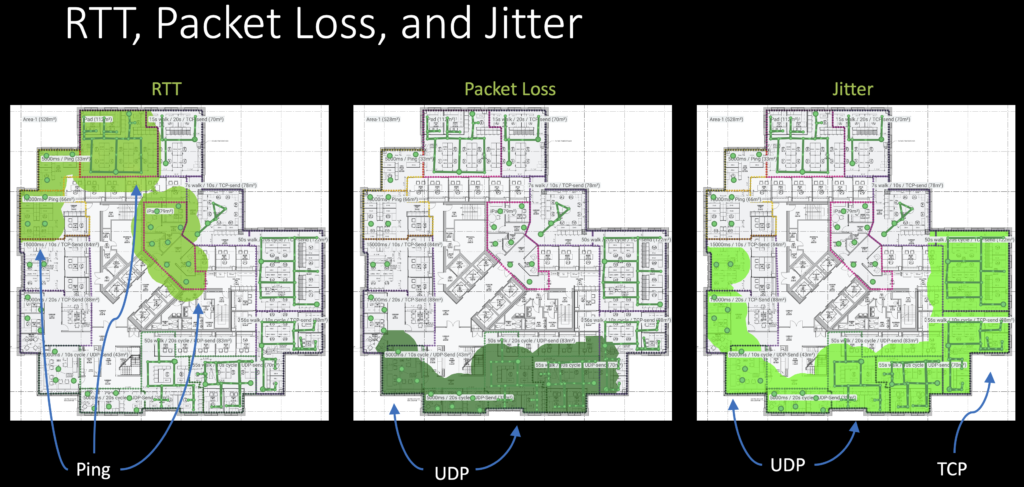
Ping collects only round-trip-time (RTT) traffic, which can be displayed in the RTT visualization.
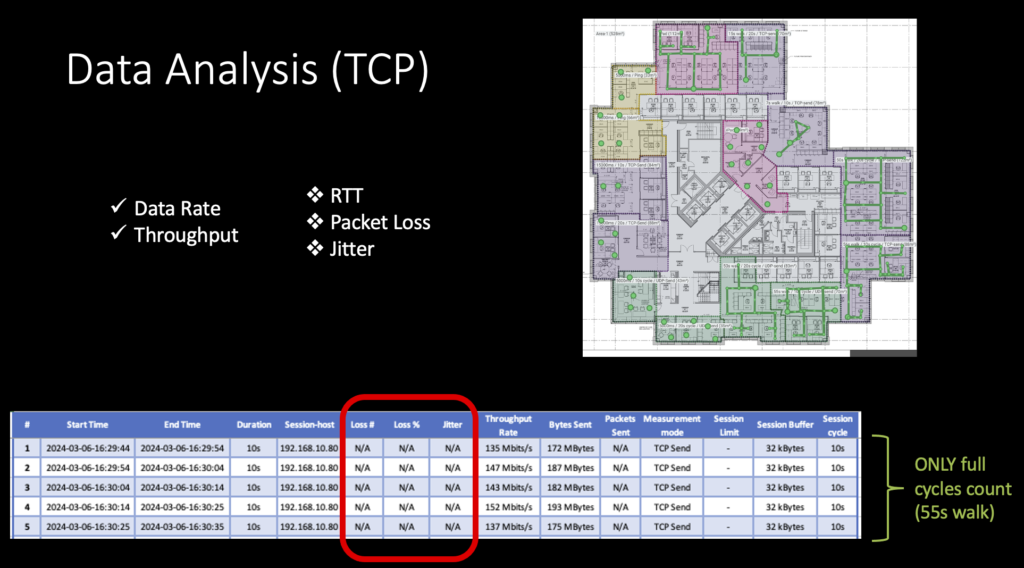
TCP collects only throughput based on the DUT and AP capabilities.
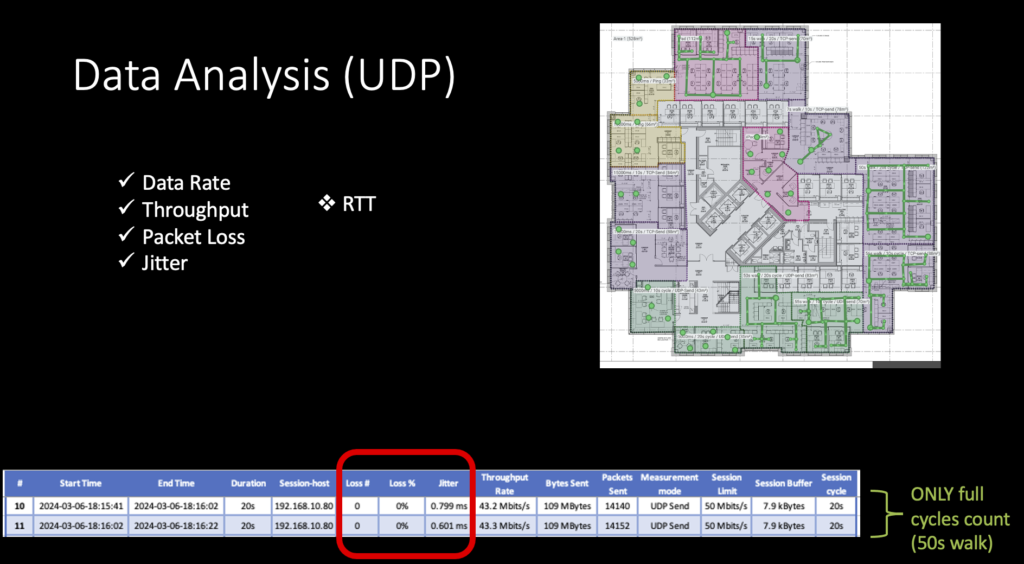
UDP collects throughput, packet loss, and jitter, which are directly affected by the capabilities of the DUT and the AP.
The metrics collected may not match the performance or experience of other devices with different capabilities when connected to the WLAN.
Analyzing the Data
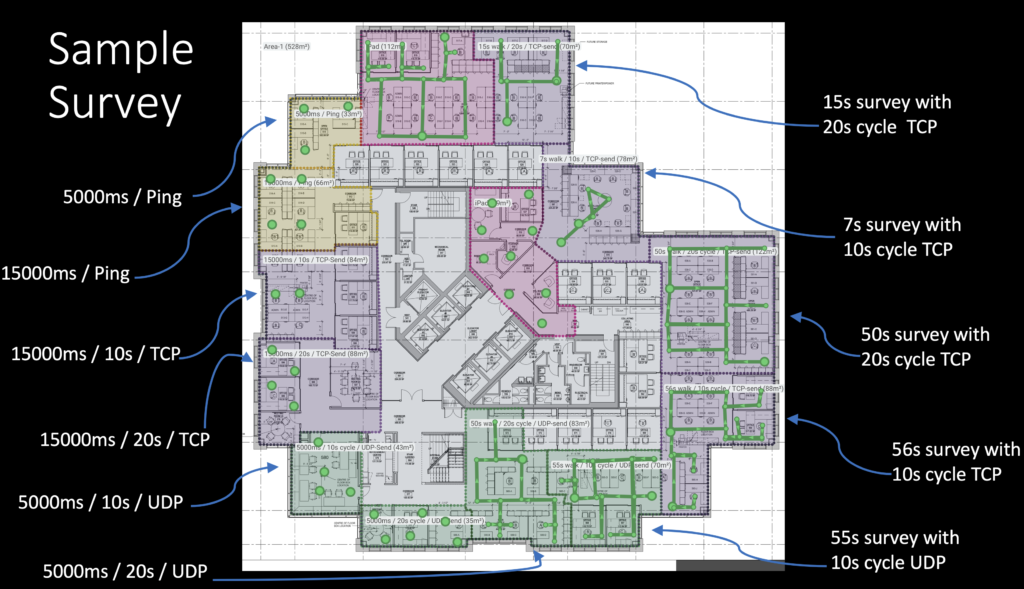
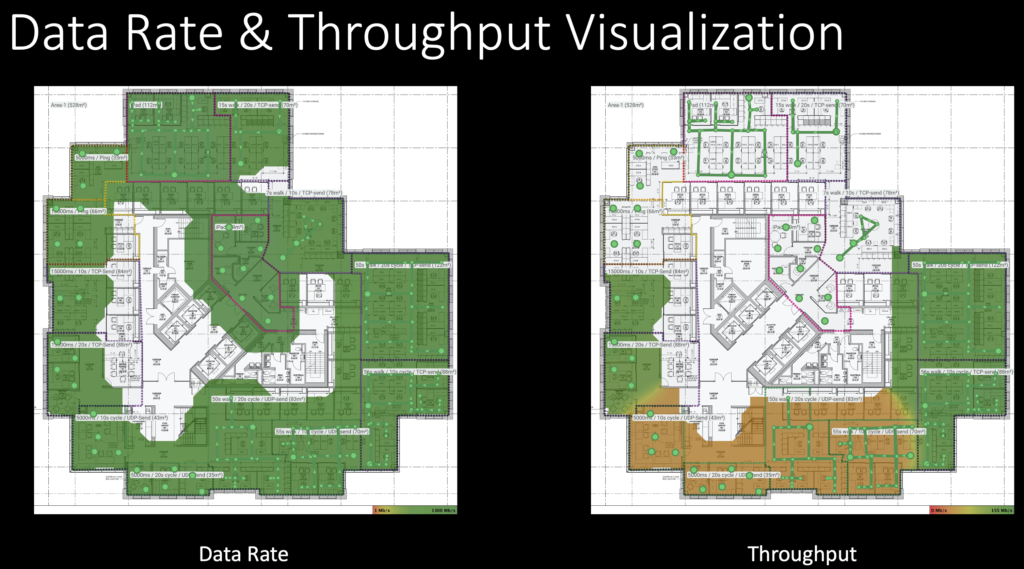
Various active survey configurations were used to generate interesting data for analysis. The image below shows a mix of Stop & Go and Continuous surveys. The cycle and Stop & Go durations were modified, and the duration of the Continuous survey (when applicable) is shown.
Area colours are used to show where different tests were run.
- Purple = TCP throughput
- Green = UDP throughput
- Yellow = Ping
- Red = iOS/Android (Ping)
Once the data was collected, a custom report template was run to dump all the TCP/UDP data into a Word document in tabular format. The template can be downloaded here with an example of the custom template and output shown below:
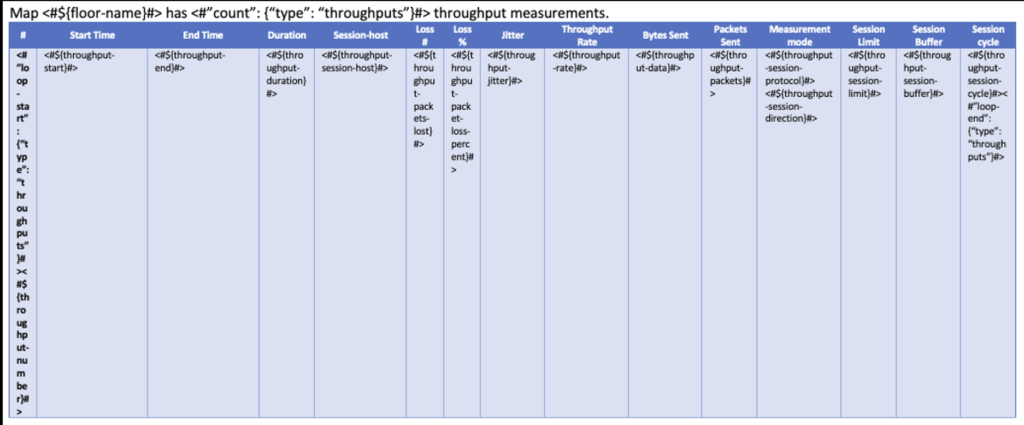
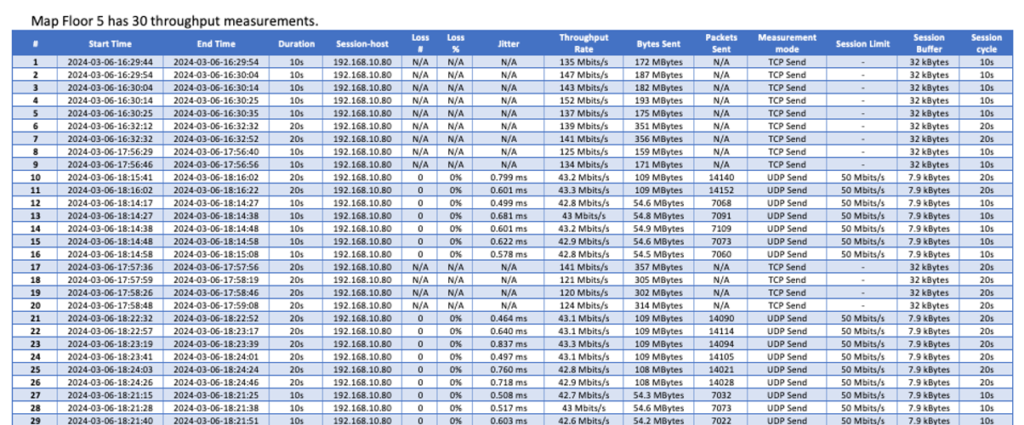
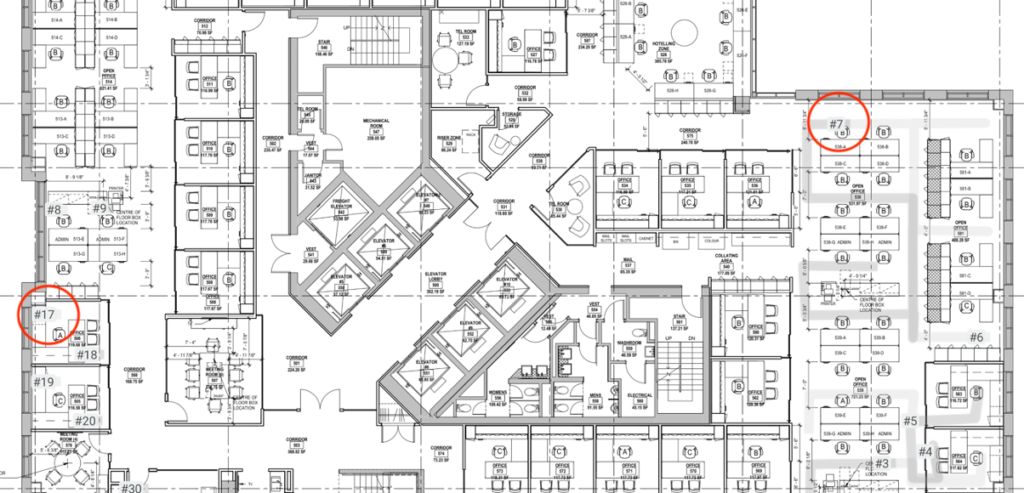
The template also generates an image of a floor plan overlaid with numbers which map to the moment each iPerf cycle occurred. Those numbers and the data associated with that iPerf interval appear in the table. This allows WLAN practitioners to correlate the data with a location on the floor plan. (A couple of numbers are circled in red as an example).
In one TCP throughput test, the cycle time was set to 20 seconds. However, the survey path duration only lasted 15s. In situations where the cycle time is longer than the survey path, the iPerf cycle does not complete, and no active survey (throughput, packet loss, jitter) data is collected during that survey path. The image below does not show heatmap data in locations where the cycle path was shorter than the cycle time.
Throughput data is also unavailable during a Ping test (the only option available when using iOS/Android). This is why the top section of the floor plan has no heatmap data displayed in the heatmap visualization. The Data Rate visualization shows data in all locations, as the Data Rate is determined by the capabilities of the APs within beacon frames. This does not accurately reflect the data rate that all clients should expect to experience.
Some TCP throughput tests were run during which the survey path lasted 50 seconds (configured with 20-second cycles) or 56 seconds (configured with 10-second cycles). In both cases, the survey path duration modulo was non-zero. Any data collected during an incomplete cycle is discarded.
A survey path duration of 50 seconds with a cycle time of 20 seconds means 10 seconds of lost data. A survey path duration of 56 seconds with a cycle time of 10 seconds means 6 seconds of lost data. Data collected during the remaining 5 seconds would be ignored – only complete cycle intervals are captured.
Some TCP throughput tests were run during which the survey path lasted 50 seconds (configured with 20-second cycles) or 56 seconds (configured with 10-second cycles). In both cases, the survey path duration modulo was non-zero. Any data collected during an incomplete cycle is discarded.
A survey path duration of 50 seconds with a cycle time of 20 seconds means 10 seconds of lost data. A survey path duration of 55 seconds with a cycle time of 10 seconds means 5 seconds of lost data.
Some Stop & Go tests were run during which the Stop & Go (Ping) time was set to 5000 ms- cycles) and the throughput cycle time was set to 20 seconds. In this case, the spinning wheel of the Stop & Go survey lasts 20 seconds when performing a UDP or TCP test. With the same configuration applied, a Ping test performed in Stop & Go mode lasts the default 5000ms.
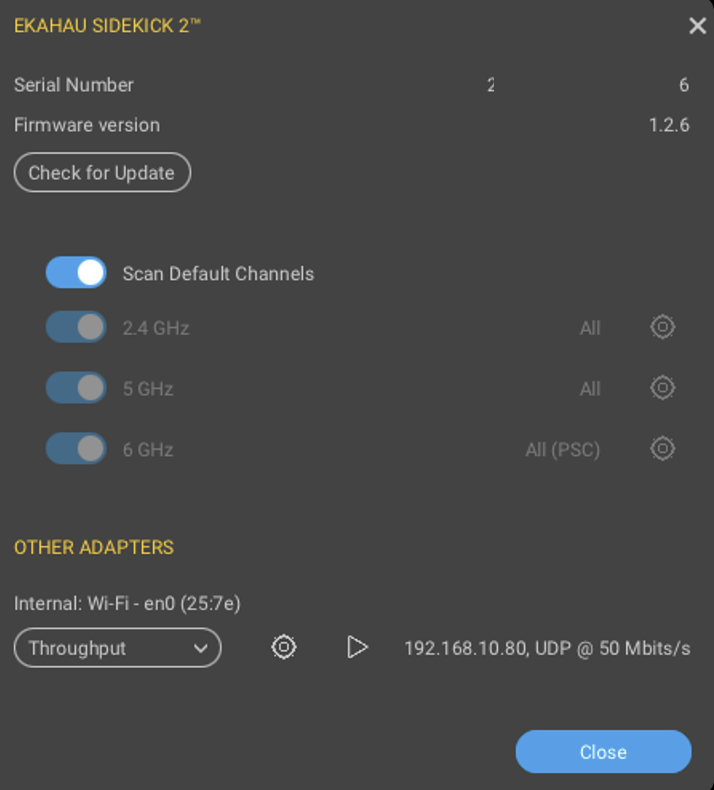
Why would you want to scan longer than 5000 ms in a Stop & Go survey? Well, depending on how many channels you want to scan, it could take longer than 5000 ms – see the image below.
In a continuous survey, Ping tests run constantly, which would be the experience on an iOS/Android device.
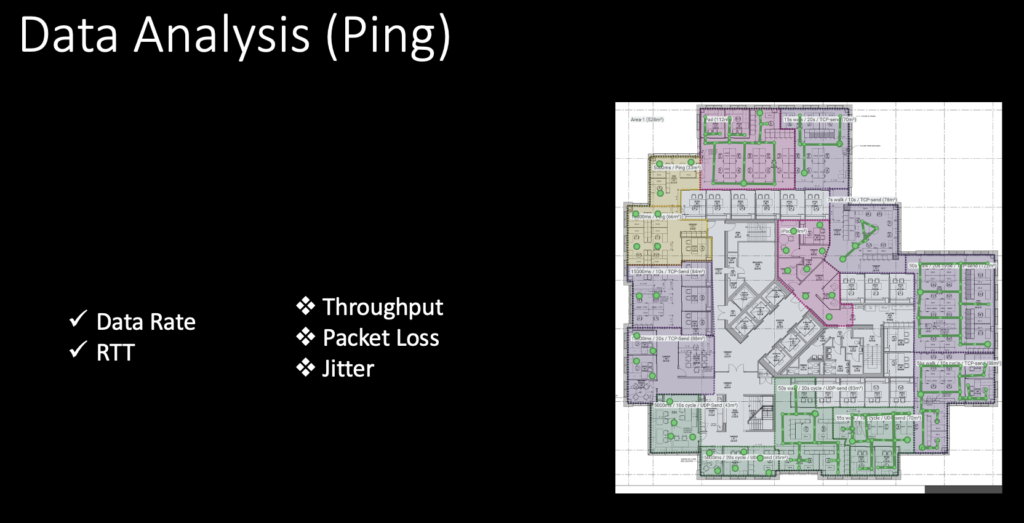
The image below shows locations where RTT, packet loss, and jitter data were collected. At this point, it should be no surprise that RTT data was only collected during Ping tests and thus only appears in the heat map where an iOS/Android device or a laptop running AI Pro configured in Ping mode was used to collect data.
Packet loss and jitter heat map data only appear at locations where UDP mode throughput tests were used. It does not matter if a continuous or Stop & Go method was configured, but packet loss and jitter are only available when surveying from a laptop using AI Pro when configured in UDP mode.
Summary
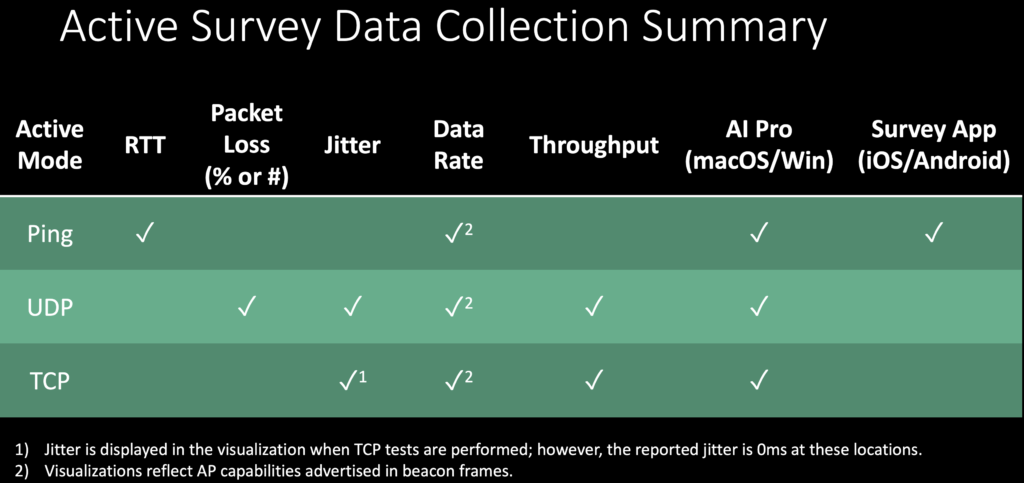
The table below summarizes the data collected using various active survey modes and the type of device that is supported. Android/iOS devices are limited to ONLY performing Ping/ICMP tests and collecting RTT metrics.
Best Practices for Active Surveys
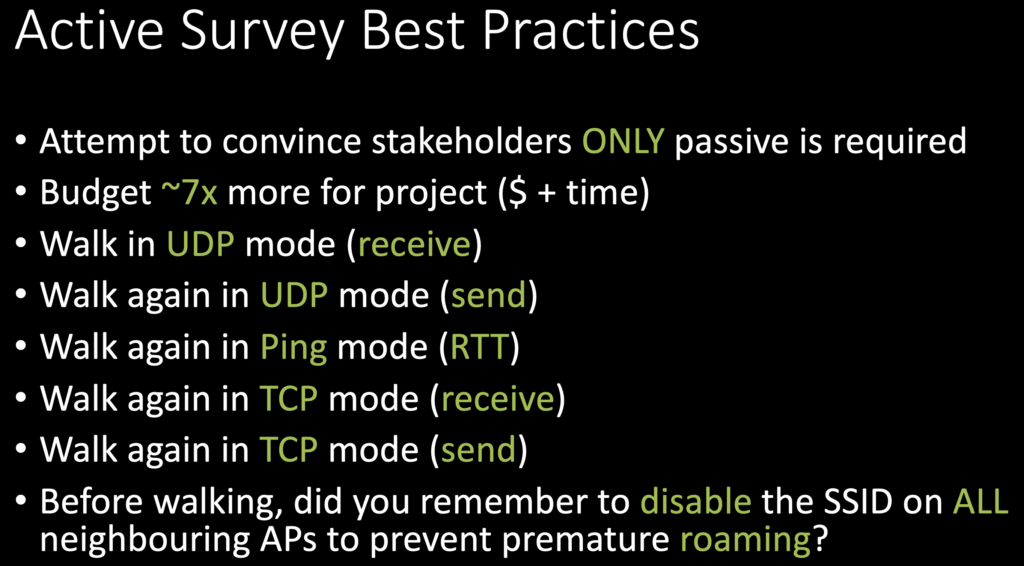
The image below summarizes best practices for using Ekahau when conducting an active survey. Other best practices for more useful active data collection exist when the device supports the critical application.
For example, if Voice over Wi-Fi is a critical application using iPhones, Cisco 8821 Wireless IP Phones, or Vocera badges, run an application on that device to stream real-time audio or video. Do not use buffered audio or video, which can mask performance issues. While performing a passive survey, carry this active DUT (device under test) around and monitor the application performance. Note any areas where you notice audio dropouts or macroblocks on the video feed. For the audio, I wear headphones, but keep in mind, if the headphones are wireless, there will be a BT interference that follows you everywhere during your survey. Return to those locations later and investigate deeper to determine the cause of the performance issue and rectify it.
Slàinte!
Resources
Throughput survey data – custom report template example
Library of customer report templates (originally hosted by Nick Turner)
https://www.dropbox.com/sh/pu45g0qwne80kgn/AAAN8bPX5NxfR4YRbkuG5Uwea?dl=0
Hive Radar
Wi-Fi Site Survey Kit
Vantage Poles (telescopic poles for high ceilings)
Open Reality Group YouTube Channel
https://www.youtube.com/@OpenRealityGroup
Wi-Fi Design Day 2024 Highlights
Active Survey Data Presentation from #WiFiDesignDay 2024